We’ve all been amazed by the trend in Gold prices during 2016 so far, but this last few weeks, since a spike higher after the Brexit decision, Gold has fallen back somewhat. Is the Gold bull over for 2016? Or is this just another dip to buy into?
It’s obvious at some point the strong trend will end. After all, profit needs to be taken before a new leg up can commence. Usually the speculators will unwind over-leveraged long positions, and prices will fall until they reach a technical level, or another key piece of economic data goes in favour of Gold.
There are some who think we may see a sustained correction in Gold, as the US presidential election begins to take hold. Often the run in to the election sees a strong stock market. Whilst they often never move in tandem, this year (so far) they have, which is somewhat unusual.
So from a technical point of view, is there anything to look at, up here at the dizzy heights of $1300+ for Gold?
My eyes immediately hooked onto a trend line, which begins at the Brexit spike, and seems to have bounced from it in early trading today.
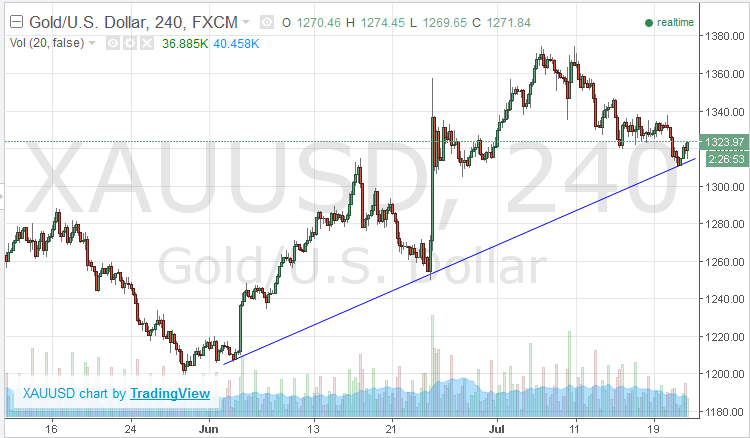
It’s not a sure thing, but it seems about the only level, apart from the $1300 resistance we broke through in late June, that could offer a turn from this current slide in Gold prices.
If it does adhere to the line, then you would think Gold may try to attempt to reach $1390 or thereabouts, which is the early 2014 high. We all know it does like to go test, and re-test these technical levels for volume. I’d be certain if it got to that point, there would be plenty!
For long term though, Gold seems a good long bet as long as buyers keep appearing under technical levels.
from http://www.livecharts.co.uk/livewire/2016/07/is-this-the-new-trend-line-for-gold/