Thursday 15 December 2016

Oil Prices: How Much Further Will They Let This Slide?

Oil prices are heading back down it seems. After spiking to a high above $54 on the basis of a cut in production by Russia and other countries after the OPEC landmark deal, it’s been falling steady. There’s already a concern on trust in the statement from OPEC if it will adhere to what it says.

The IEA stated that IF the cuts go as planned: “Oil stockpiles will decline by about 600,000 barrels a day in the next six months as curbs by OPEC and its partners take effect”.

That is all well and good. But the question remains can the Oil producers be trusted to deliver on this pledge? Its common knowledge that both OPEC and non-OPEC oil producers are unwilling to cut, and unwilling to co-operate. In addition the latest report from the IEA showed that Oil was flowing at full throttle during November.

So while the picture remains cloudy, where we stop to the downside is a bit of an unknown. We know that all producers want to stabilize oil prices. Nobody really wants oil back at the 2016 lows for a sustained period of time. Which begs the question, where is the support?

The chart below shows a trading range, which is ever so slightly pointing upward. You can clearly see why the high retraced from where it did, and with oil being an instrument that likes to retest its supports, the lows or bottom of range should be reached soon.

oil-chart

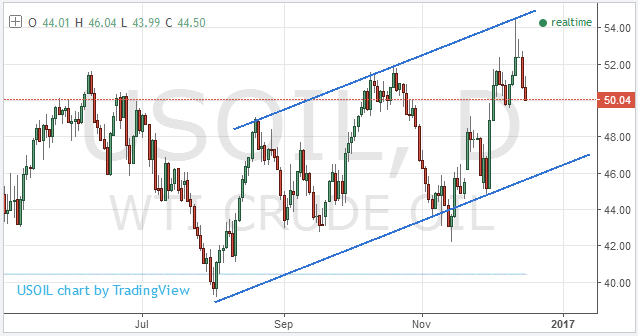
If the low channel line isn’t hit, then it’s possible that a round number such as $50 or $48 may be the target. At some point buyers will appear, watch for volume on any quick spikes back up. Bounces coupled with volume signal where the traders see value, and can often offer a medium term support.


from http://www.livecharts.co.uk/livewire/2016/12/oil-prices-how-much-further-will-they-let-this-slide/

Thursday 3 November 2016

Gold Prices and Where Next At This Resistance?

Gold gained good ground over the last week, after an early October fall through support. However, the fall stalled and found a base around the mid-point of the February to May range. Gold mining stocks had seen a phenomenal run, with some of the big players up over 200% and more from early 2016 lows, most pulled back strongly in-line with Gold prices.

So what is next for the metal we all love?

The current up-trend was abruptly halted yesterday by the FOMC monetary policy. There was no rate shift, and added a little hint that the next hike could come next month, but for now Gold touched the underside of the support that broke in October and may consolidate below for a while.

To make a break through this level, which could end up being quite a strong resistance as proven before, it may take a data shock or an “election” shock. Surely a Trump victory would be the catalyst to propel the Gold price to new highs for 2016. There’s not too long to wait.

gold-november

The chart above shows the line in the sand that needs taken out before Gold can make any decisive move higher. It was tested twice before it was smashed on the Brexit vote, and here we are again, after our first re-test.

Could the shock of Donald Trump winning the election be the next “Brexit” spike for Gold?

Quite possibly. Until this last week Trump had been lagging in all the polls. Most people were of the thought school that Clinton should walk this election “no problem”. But Brexit shows that this type of thinking can be wrong when the people really want change.

It would be a shock, and uncertainty will follow. No doubt Gold would rocket, back to the highs, and possibly beyond as time moves by.

The only piece of data before then which has the potential to shift the Gold price higher is the Non-Farm Payroll data on Friday.

On 3rd of June the NFP data came in below forecasts by a huge amount. It was forecast for 159k and actual landed at 38k.

This saw Gold rocket from the 3 month low to above $1300 during the next two weeks preceding the Brexit vote. If NFP is skewed again, maybe Gold will set off on a run before the election, although it could be somewhat subdued following through until next week is out of the way.

Either way there are some interesting days ahead for those who follow Gold.


from http://www.livecharts.co.uk/livewire/2016/11/gold-prices-and-where-next-at-this-resistance/

Tuesday 1 November 2016

Interest Rates Abound as Election Time Looms

As we move ever closer to the US election, what more could you ask for than a week packed with highly anticipated economic data? Expect Gold and stock indices to be volatile as we move into the second half of the week. Here’s a quick rundown of what’s about to land.

Already, as of Tuesday November 1st we’ve had BoJ and Australian interest rate announcements. The Bank of Japan held their already negative rate at -0.10%, and Australia remained unchanged at 1.5%.

The Australian Dollar headed straight up towards October highs against the US Dollar on the decision that matched forecasts, whilst USDJPY was static in comparison.

Tomorrow, Wednesday 2nd November, we’ve the big event. All eyes will be focused on the Federal Funds Rate in the USA. It’s been 11 months since they hiked the rate for the first time in years. Whilst it’s widely forecast to remain unchanged maybe there’s a surprise in store?

Gold has been creeping up slowly during the last few trading days, which seems to suggest traders are betting on the forecast of “no change” holding true.

Thursday 3rd of November is the United Kingdom’s turn. At midday UK time the Bank of England drops its monthly rate decision, again it’s expected to be unchanged at 0.25%. The rate was lowered in August as the uncertainty of Brexit hit hard on the Pound. Alongside the BoE rate, they also publish their inflation report. All in all it should be a volatile time for traders of GBP.

If all this is not enough for you, then make time for Friday’s Non-Farm Payroll data in the USA. It’s always a big market mover, and probably even more so after the Fed reporting in the same week.

Forecasts are that the figure will increase by 20k on the month however it missed, and fell by near 20k last month, so another miss may be the trigger to cause some volatile swings on stock indices.

This sets us up nicely for the ride into election time, November 8th. By the back end of next week we should know who will be the leader for the next 4 years. This in itself will probably cause major volatility, as it’s been the most unusual election in most peoples living memory.


from http://www.livecharts.co.uk/livewire/2016/11/interest-rates-abound-as-election-time-looms/

Wednesday 21 September 2016

Fed Meeting Set To Show The Way

The next installment of the Federal Reserve meeting, with the press release that is published at close the meeting of the Monetary Policy Committee. This is followed by a press conference hosted by the president of the Fed, Janet Yellen. All eyes are on comments surrounding interest rates, and how the Fed see’s the economy is fairing.

Today on the foreign exchange market, the Euro was trading within narrow ranges despite the huge adjustment in policy by the Bank of Japan (BoJ). Although it is normal for the Euro to trade static in light of a upcoming Fed meeting.

The euro has remained steady against the dollar at 1.1149 and versus the Yen at 113.03

During the night, the Bank of Japan (BoJ), the Monetary Policy Committee announced new measures. The BoJ has decided to adopt a target on its long-term interest rates. This change in its monetary policy strategy is a surprise, three years after the launch of a bold policy of the Governor Haruhiko Kuroda, who gave way to skepticism about its effectiveness.

According to analysts the objective is to try and counter the negative effects of redemption of bond assets in bulk, pulling the short interest rate and longer term under 0.

In the USA, Fed funds futures anticipate a rate hike this evening with a probability of 15%. From the many economists surveyed by Bloomberg, only 4 anticipate a rise in Fed Funds tonight, barely 4% of consensus. Which is usually a sign that there will be no change, however there is always room for a shock.

As always expect volatile moves after the Fed release their data. Stocks, Gold and Foreign Exchange markets are poised to make a move, guessing can spell disaster. Whilst these data sets can change a trend, more often than not they do not change the longer term direction, once the initial volatility has subsided.


from http://www.livecharts.co.uk/livewire/2016/09/fed-meeting-set-to-show-the-way/

Thursday 8 September 2016

FTSE 100 and Dow Jones: Can They Head Higher This Year?

Indices in the UK and USA have been on a phenomenal run since the early February, a rise that accelerated with post Brexit relief. Whilst the FTSE 100 stumbled its way up slowly in anticipation of the Brexit vote, the Dow Jones Industrial Average has been strong all the way through, really strong. So much so that it’s now standing at all-time highs above 18400.

But what is next for these blue chip indices? Can this strength continue, or will it all end in tears?

FTSE 100 Index

Banks are still lagging somewhat. And so are home builders, since being hit with uncertainty of Brexit. Although they’ve recovered slightly from those lows, there’s still room for more in the main players. Barclays share price remains under £2, Lloyds share price remains under 60p. If banks can begin to shed some of the negative sentiment that Brexit brought them, this could help push the FTSE 100 higher into winter.

The chart below shows the breakout point of the early 2016 high and subsequent rise to a touch underneath 7000. Will it push multi-year highs like its US cousin? Probably, but only if banking stocks and home builders begin to pull their weight again.

ftse 100 daily

Dow Jones Index

Stocks in the Dow Jones are flying, it’s fair to say. Bank of America has put on near to 50% this year alone. The Home Depot printed a new all-time high, as did General Electric Company. Whilst Apple has stuttered compared to previous years, other tech stocks like Microsoft Corporation have been in a strong upward trend.

In the chart below you can see (like the FTSE 100) a breakout of early 2016 high into a small wedge like pattern which seems to be consolidating at new all-time highs.

Dow Jones Daily

Will it push higher? This is a tricky question. Its election year in the USA, and there’s no hiding from the fact that if Trump gets into the White House, this will bring uncertainty. The US markets are usually strong running into elections, which seems to be the pattern right now, whether this will continue post-election is the million dollar question.

One thing to watch: If Trump wins the election there will most likely be a rush of money into Gold from Stocks. Keep an eye on Gold as we approach the election, it may give some clues as to which way traders are placing their bets.


from http://www.livecharts.co.uk/livewire/2016/09/ftse-100-and-dow-jones-can-they-head-higher-this-year/

Thursday 21 July 2016

Is This The New Trend Line For Gold?

We’ve all been amazed by the trend in Gold prices during 2016 so far, but this last few weeks, since a spike higher after the Brexit decision, Gold has fallen back somewhat. Is the Gold bull over for 2016? Or is this just another dip to buy into?

It’s obvious at some point the strong trend will end. After all, profit needs to be taken before a new leg up can commence. Usually the speculators will unwind over-leveraged long positions, and prices will fall until they reach a technical level, or another key piece of economic data goes in favour of Gold.

There are some who think we may see a sustained correction in Gold, as the US presidential election begins to take hold. Often the run in to the election sees a strong stock market. Whilst they often never move in tandem, this year (so far) they have, which is somewhat unusual.

So from a technical point of view, is there anything to look at, up here at the dizzy heights of $1300+ for Gold?

My eyes immediately hooked onto a trend line, which begins at the Brexit spike, and seems to have bounced from it in early trading today.

gold-chart

It’s not a sure thing, but it seems about the only level, apart from the $1300 resistance we broke through in late June, that could offer a turn from this current slide in Gold prices.

If it does adhere to the line, then you would think Gold may try to attempt to reach $1390 or thereabouts, which is the early 2014 high. We all know it does like to go test, and re-test these technical levels for volume. I’d be certain if it got to that point, there would be plenty!

For long term though, Gold seems a good long bet as long as buyers keep appearing under technical levels.


from http://www.livecharts.co.uk/livewire/2016/07/is-this-the-new-trend-line-for-gold/

Wednesday 1 June 2016

WIll Gold Hold Out Above $1200?

It’s safe to say that May was a hell of a bearish month for gold prices, in fact it’s been the worst month of the year so far for the precious metal. Gold prices fell from a high of $1300 on 2nd May to a low of $1200 on 30th May.

This abrupt end to the short term bull run in gold was mainly triggered from the Fed’s comments on the possibility of an increase of interest rates in June. It was previously thought that any further hike in interest rates would be put on the back shelf until the last quarter 2016. However, they now see the possibility of raising rates earlier and think the economy could withstand a small hike.

Miners Trying To Hold On To Gains


Whilst gold slid almost 6% from its high is worth noting that this low area has been a support since the parabolic surge in early February 2016. It is also worth noting that many of the gold mining stocks which make up GDX have not experienced spectacular falls that such a slide in gold prices should create. Companies such as Barrick Gold (ABX) and Newmont Mining Company (NEM) have pulled back but their share prices remain above the April 2016 highs.

Many analysts and commentators are suggesting that this pullback in gold could be a huge opportunity for money on the sidelines to pile back into the precious metal. They say the rise since February is not just a short term bull trend, but the beginning of a multi-year trend in gold, and if that is the case then a strong retrace such as this could actually be a fantastic opportunity.

However, it all comes down to how the Federal Reserve play this out. If they do decide to hike rates earlier than was expected then it’s possible that gold could break beyond this $1200 support and go on to test lower levels. Conversely, if the Fed decide not to hike rates, and the fear was unjustified, then it should cause one huge spike upwards in gold prices.

June is certainly going to be an interesting month for investors of precious metals.

Thursday 19 May 2016

FTSE 100 Sinks To Lows, Results from Britvic, Mothercare, Thomas Cook, Bloomsbury

The FTSE 100 index has traversed to the lower end of its current trading range between circa 6060 and 6200. The low in UK morning session stood at 6068 as Crude Oil pulled back for a 2nd consecutive day. Gold was also sliding again, after comments in the Federal Reserve’s minutes that were bias toward another interest rate hike, whilst most analysts had predicted June was off the radar.

In the UK, some major companies were publishing results. Here is a quick overview of some of the movers.

Britvic plc (BVIC) published Interim results showing a first half revenue gain of 5.1%. Profit after tax was also increased by 7.5% to £41.7m, and dividend was raised to 7p. However, organic revenue (excluding from Brazil) fell 1.8% for the period.

Highlights from the group included a 7 year deal with Subway for positioning of the Britvic and Pepsi brands. Fruit Shoot multi-packs are being launched on the USA grocery channel. Simon Litherland, Chief Executive Officer stated, “We have reported a 7.1% increase in EBITA in the first half of the year despite the challenging customer environment and continued price deflation in our core markets.”.

Thomas Cook Group PLC (TCG) stated despite disruption in some key markets, they were able to make significant progress. This set of results showed a narrowing of losses at the holiday group, pretax loss was at GBP208m, compared to a loss of GBP303m for the 2015 period. TCG share price was down 18% in early morning trading.

Mothercare PLC (MTC) published a swing into full year profit. Underlying profit before tax was up 51% at £19.6m. Online sales were also up by 15% and losses reduced by 64%. This could be a major turning point for the company. Mark Newton-Jones, Chief Executive, said, “I’m pleased to report that two years into our turnaround strategy we have recorded a 51% growth in underlying profit before tax and the delivery of our first statutory profit in five years.”.

Bloomsbury Publishing PLC
(BMY) the famous book publisher of the Harry Potter series published a jump in revenue of 11% to £123.7 million. Profit before tax gained 8% to £13.0 million. It was reported that sales of Harry Potter in the year grew by 133%, the Children’s and Education revenue increased by 57%.

Wednesday 18 May 2016

FTSE 100 Stuck In March Range, Results Round Up May 18th

After a couple of indifferent days the FTSE 100 is stuck back in the range that held it trapped during March. Oil continued its climb toward $50 but halted, Gold still holds above $1250, whilst Technology Hardware & Equipment and Mobile Telecommunications are the leading sectors in the UK during early trading on the 18th May.

There’s been some company results reported to the markets today. Here’s some short snapshots of what was released.

SABMiller PLC (SAB) reported a drop in full year profits from $4830M in 2015 to $4074M for 2016. Also down was revenue to $19,833M from $22,130m in 2015. Dividend was hiked by 8%.
Alan Clark, Chief Executive, said: “These are good results. We grew EBITA across all regions and our group EBITA margin improved through the year, on an underlying basis.” and, “As noted through the year, the strengthening dollar against our operating currencies had a material negative impact on reported results.”

Burberry Group PLC (BRBY) announced preliminary results for the year ended 31 March 2016. Revenue was £2.5bn, down 1% underlying, adjusted profit before tax down £35m to £421m. However it was also announced that full year dividend is at 37p, up 5%, and a share buyback of up to £150m is going to commence in 2017.

Christopher Bailey, Chief Creative and CEO, stated: “While we expect the challenging environment for the luxury sector to continue in the near term, we are firmly committed to making the changes needed to drive Burberry’s future outperformance, underpinned by strong brand and business fundamentals.”.

Marston’s PLC (MARS), the high quality pub and beer business, announced a turnaround in their Interim results for the last 26 week period, with a profit before tax up 11.8% to £33.1 million. This compares to a loss of £27.5M in 2015. Revenue was also up 11.5% to £428.7 million. They stated that operating profit was able to grow by 16% due to the Thwaites acquisition.

Ralph Findlay, CEO stated: “We are encouraged by our first half performance and are on track to meet our expectations for the year. In pubs, we have driven our growth by the organic development of pub-restaurants and franchise-style p