Showing posts with label Live Wire - Financial Blog - Oil Gold Economics Forex. Show all posts

Friday, 9 June 2017

FTSE 100 Holds Firm as Election Ends With Hung Parliament

A hung parliament was declared in the U.K. general election which resulted in some wild swings overnight for the FTSE 100.

After ending slightly down on Thursday, the main share index was priced by spread betting companies as down 100 points as the exit polls were announced.

During the early hours, one by one the results came in and the overnight price gradually began to recover. When it became apparent that the Conservative party would continue to hold the most seats and have the ability to form a coalition Government, the FTSE 100 price jumped when the market opened and headed toward the weeks highs.

And there it stayed, pretty much.

For the rest of the trading day the index held tight in a 50 point range from 7480 to 7530, give or take a few points.

Relief all round for investors who would have taken a Corbyn victory as a signal to sell, with extreme uncertainty in the city about how his Labour Government and their policies would affect business growth.

As for individual sectors, the majority were buoyed by the result and finished positive. The main laggards were general retailers and food producers, as the value of sterling declined – pointing to imports become more expensive.

The British Pound fell 300 pips overnight when exit polls were announced but managed to recover a small piece of ground during the morning session in Europe.

Further pressure is expected for sterling over the coming days. Once again uncertain times in the U.K. are on the horizon, with Brexit talks about to begin and no Government yet in place to move the process forward.

One thing is for sure- it’s never dull for long on the UK markets!


from http://www.livecharts.co.uk/livewire/2017/06/ftse-100-holds-firm-as-election-ends-with-hung-parliament/

Tuesday, 23 May 2017

Opec Trying To Put Some Support Into Oil Prices

This week began in much the same fashion as they left last week with Oil prices rising. Expectation of a cut in output from OPEC, which could extend into 2018, pushed Crude Oil higher on the futures exchanges. In early trade UK on Tuesday, Brent Oil had fallen back from it’s high, but still remains over $5 higher than the early May low.

Oil prices have also been aided by a falling US Dollar, which has been on a steady downward trajectory for the last 10 days.

Market commentators are wary of the output cut talk, with many waiting to see the outcome of the Opec meeting on Thursday. Analysts state that they are not too sure how far OPEC can actually cut, whilst global demand is somewhat subdued, and US shale production on the rise. But we shouldn’t underestimate the need for OPEC, and particularly Saudi Arabia to keep Oil prices up and around the $50 per barrel mark.

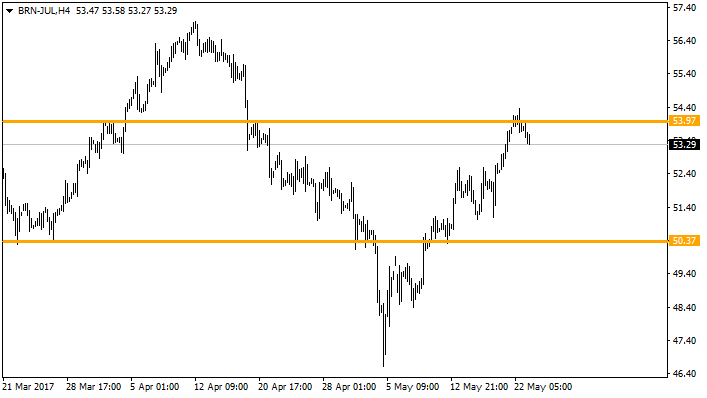
In the short term there are now some clear points on the charts for some support and resistance. Below us, just above the $50 round number, and above us at the high of Monday.

brent-crude-june

It seems that each time Oil prices manage to gather some downward momentum, to under $50, that OPEC springs into action. This is set to continue (no doubt) into 2018, and many analysts comments are suggesting that prices are set to rise into 2020 and beyond as supply will not match the pace of demand, even in the face of greener energy sources.

There has been a lack of investment into Oil industries over the last two or three years. Obviously there will need to be a period of catching up. Demand will still be high, but supply may not reach the expected amounts for a while. This has fuelled comments from leading sources stating higher prices for Oil, and many other commodities into the early part of the next decade.


from http://www.livecharts.co.uk/livewire/2017/05/opec-trying-to-put-some-support-into-oil-prices/

Monday, 8 May 2017

Gold Prices and Why There’s Nobody Buying

At the back end of last week Gold prices slid to levels not seen since mid March, all-in-all it was Gold’s worst performing week of 2017 so far. The recent strength of the US Dollar put pressure on Gold as expectations of a rate rise grow.

The US Fed gave indication that planned rate rises this year were still on track, with many commentators looking to June as the likely month they will increase. The strong non-farm payroll data on Friday reinforced this thinking.

Gold can suffer while the Dollar strengthens because commodities priced in US Dollars become more expensive, and demand from those trading in other currencies often falls.

Goldman Sachs remain cautious on Gold prices in the near term, stating: “In the very near term we continue to expect that gold will trade moderately lower – our three-month target is $1,200/oz, as a number of bearish catalysts have yet to fully play out,”.

With stocks still rising and consolidating near all-time highs, there seems to be no rush to Gold either from worried investors. However, it would be worth keeping an eye on Gold, for any sudden movements from a support level, as stocks may pull back slightly as the summer months commence.

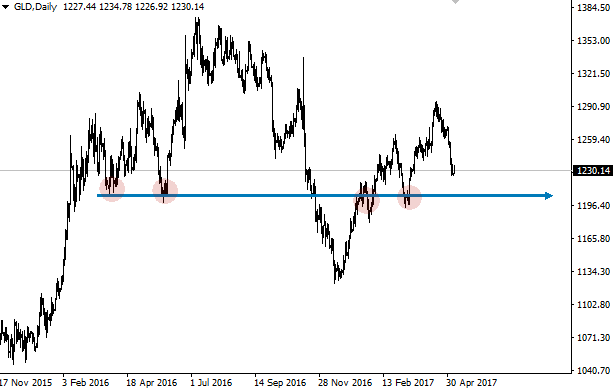
What is worth noting is that Gold currently trades above a reasonably strong level of support around $1200. On the chart below you can see the touches of lows and attraction to that price level.

gold-support

This really should be the line in the sand that investors will be watching. A hold above could see the next move in Gold head higher, consequently a clean break of this level (maybe on a rate rise) could signal further weakness and tests of levels from late 2016.

Either way there is something brewing. A critical time for Gold approaches.


from http://www.livecharts.co.uk/livewire/2017/05/gold-prices-and-why-theres-nobody-buying/

Monday, 20 February 2017

Life Insurance Sector Continues It’s Strong Start To 2017

Shares in the Life Insurance sector have been on a steady upward trajectory since the turn of the year, after a relatively static 2016 (apart from a Brexit blip). Leaders today were Standard Life, Prudential and Aviva as the pack went on rising.

Many analysts were of the opinion that Donald Trump’s policies were pointing to higher interest rates in the US, which would probably put a squeeze on insurance companies. But so far the opposite seems to be playing out.

A news piece on Sharecast just last week stated, “Traders cited comments from US president Trump during the afternoon saying he would have “something phenomenal” on taxes over the next two to three weeks as a reason for the uptick in ‘risk appetite’”. This lead to a bounce of Banking and Insurance stocks, and government bond yields, in the USA.

As for the UK Life Insurance sector , in the chart below you can see it is now trading above the 2016 highs and seems to have strength.

life-insurance

Aviva, one of the UK’s largest insurance companies is back on the rise. After correcting slightly in January, it’s now bouncing again and headed up above £5.00 per share.

aviva-share-price

Standard Life also seems to have its mojo back, with a sharp rise in February to a high of around £3.70 a share.

standard-life-share-price

Prudential is also following the sector trend, with a solid rise above 15.00 in December and holding that level ever since. Looking like it will break on, or at very least retest, the 2017 highs.

pru-share-price

As 2017 progresses and stance on interest rates becomes clearer, not just in the UK but also the USA, the sector may go through some bumpy patches. However, it could offer a nice dip to a support for any long term positions.


from http://www.livecharts.co.uk/livewire/2017/02/life-insurance-sector-continue-its-strong-start-to-2017/

Friday, 17 February 2017

Can The FTSE Head Higher? BP, Fresnillo, and Bank Index Could Help Decide

As we head towards the end of another financial year in the UK, it’s time to look back at how the FTSE 100 has fared since our last article back here in September. At that time the US election was yet to happen, and I hinted that the main index would only head higher if the banks joined in.

Well, the banks did join in. Since then Barclays has added 50p to its share price, and Lloyds has gained circa 20%. But in my opinion one of the main catalysts to push the FTSE 100 beyond the 7000 mark was the BP share price heading up from 4.30p ish to over 5.20p a share. BP has pulled back since the middle of January, but certainly Oil was a huge help to the FTSE gaining some much needed momentum.

Mining stocks have also been flying high. Copper prices have been booming, along with most base metals. Stocks such as Rio Tinto (RIO), Fresnillo (FRES) and Anglo American (AAL) have all been very strong since December helping add some strength to the main UK index.

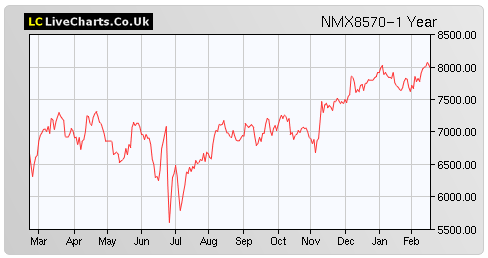
As you can see on the chart below the mining index has been on a solid upward trend for a year now. After being hit hard by falling metal prices for a number of previous years, this is a welcome relief for many mining stocks and related industries. Those companies who streamlined their business during the tough times will now be reaping the rewards of higher values.

mining-index

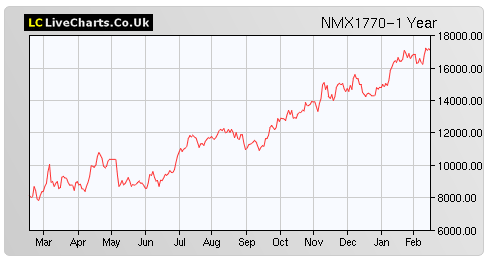
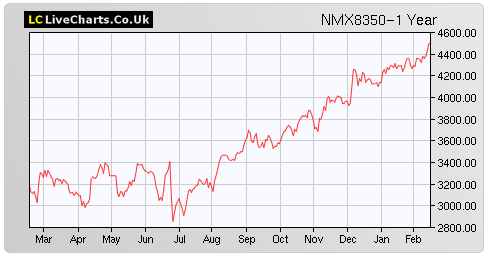
The Bank index shows a similar upward trend, which kicked in right after the vote to leave the European Union. Whilst this trend may falter somewhat as trouble looms over triggering Article 50, there should still be plenty headroom for a move higher in late 2017.

banking-index

So here we are, with the FTSE 100 around all-time highs, the Dow Jones index halfway to 21000, and everything is rosy. Maybe that is the time to be wary? Good times seldom last forever, and while this may not be the “top”, I’d be very surprised if there wasn’t a correction of sorts to shake out some money. Be safe, and be ready.


from http://www.livecharts.co.uk/livewire/2017/02/can-the-ftse-head-higher-bp-fresnillo-and-bank-index-could-help-decide/

Thursday, 12 January 2017

Gold Price Shoots Higher As Trump Offers No Clarity

The US dollar fell hard whilst gold prices shot higher as Donald Trump began his pre-presidential speech, which provided little clarity on future financial policies. The price of gold began the US session to the downside, hitting a low of $1177 before reversing strongly heading towards $1200.

It seems the speech by the soon-to-be US president left questions to be answered on hot topics such as tax cuts and infrastructure spending.

Gold reacted strongly to this uncertainty and has now reached the underside of the support levels from early 2016. You can see clearly on the chart below where we are at the right now, this area could possibly hold a little bit resistance for the price of gold in the short term. However, further uncertainty that arises as the new US president enters the White House may see gold break past this level and settle in a range up towards $1300.

gold-resistance-level

Gold prices are sensitive to changes in US interest rates, so maybe the outlook on forthcoming changes could become clearer as Janet Yellen appears at a webcast town hall meeting today. Traders will be looking for clues as to whether the central banks projection of three rate cuts during 2017 will hold firm, with many commentators suggesting there could be less.

Whilst the US dollar has been on a strong rally since early November after the shock victory from Donald Trump, recent weeks have seen the currency consolidate against most other majors, even falling against the Japanese Yen. Continued weakness in the dollar coupled with uncertainties for the stock markets could propel gold back towards the 2016 highs.

It’s quite possible the markets are waiting for Donald Trump’s inauguration on 20 January. It will be interesting to see how all markets react once the new president takes his seat.


from http://www.livecharts.co.uk/livewire/2017/01/gold-price-shoots-higher-as-trump-offers-no-clarity/

Thursday, 15 December 2016

Oil Prices: How Much Further Will They Let This Slide?

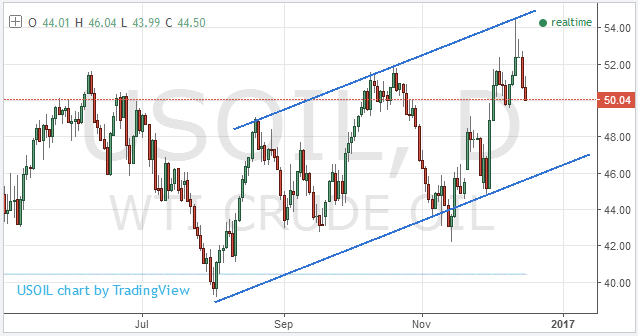
Oil prices are heading back down it seems. After spiking to a high above $54 on the basis of a cut in production by Russia and other countries after the OPEC landmark deal, it’s been falling steady. There’s already a concern on trust in the statement from OPEC if it will adhere to what it says.

The IEA stated that IF the cuts go as planned: “Oil stockpiles will decline by about 600,000 barrels a day in the next six months as curbs by OPEC and its partners take effect”.

That is all well and good. But the question remains can the Oil producers be trusted to deliver on this pledge? Its common knowledge that both OPEC and non-OPEC oil producers are unwilling to cut, and unwilling to co-operate. In addition the latest report from the IEA showed that Oil was flowing at full throttle during November.

So while the picture remains cloudy, where we stop to the downside is a bit of an unknown. We know that all producers want to stabilize oil prices. Nobody really wants oil back at the 2016 lows for a sustained period of time. Which begs the question, where is the support?

The chart below shows a trading range, which is ever so slightly pointing upward. You can clearly see why the high retraced from where it did, and with oil being an instrument that likes to retest its supports, the lows or bottom of range should be reached soon.

oil-chart

If the low channel line isn’t hit, then it’s possible that a round number such as $50 or $48 may be the target. At some point buyers will appear, watch for volume on any quick spikes back up. Bounces coupled with volume signal where the traders see value, and can often offer a medium term support.


from http://www.livecharts.co.uk/livewire/2016/12/oil-prices-how-much-further-will-they-let-this-slide/

Thursday, 3 November 2016

Gold Prices and Where Next At This Resistance?

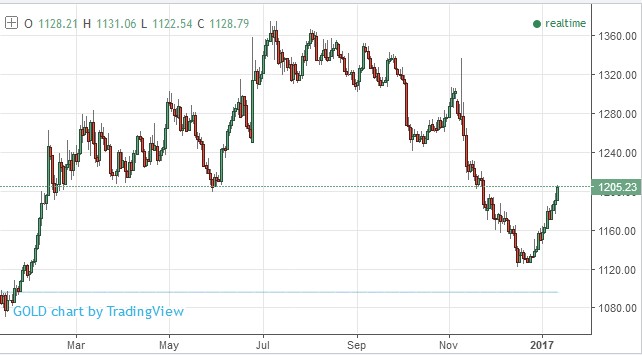
Gold gained good ground over the last week, after an early October fall through support. However, the fall stalled and found a base around the mid-point of the February to May range. Gold mining stocks had seen a phenomenal run, with some of the big players up over 200% and more from early 2016 lows, most pulled back strongly in-line with Gold prices.

So what is next for the metal we all love?

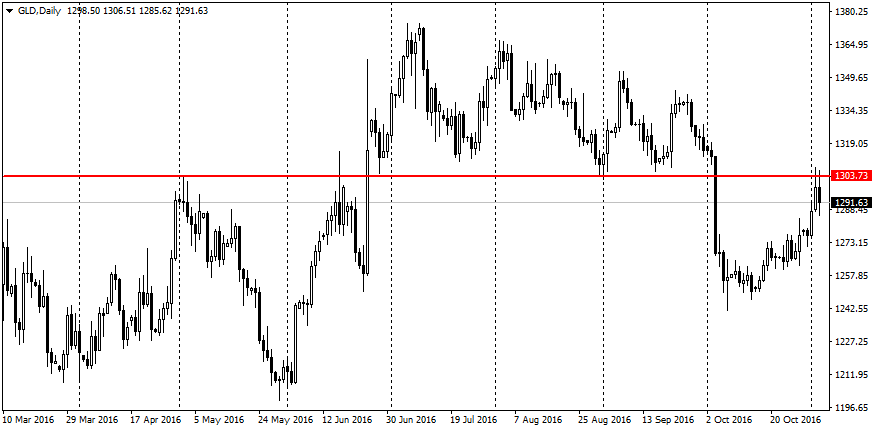
The current up-trend was abruptly halted yesterday by the FOMC monetary policy. There was no rate shift, and added a little hint that the next hike could come next month, but for now Gold touched the underside of the support that broke in October and may consolidate below for a while.

To make a break through this level, which could end up being quite a strong resistance as proven before, it may take a data shock or an “election” shock. Surely a Trump victory would be the catalyst to propel the Gold price to new highs for 2016. There’s not too long to wait.

gold-november

The chart above shows the line in the sand that needs taken out before Gold can make any decisive move higher. It was tested twice before it was smashed on the Brexit vote, and here we are again, after our first re-test.

Could the shock of Donald Trump winning the election be the next “Brexit” spike for Gold?

Quite possibly. Until this last week Trump had been lagging in all the polls. Most people were of the thought school that Clinton should walk this election “no problem”. But Brexit shows that this type of thinking can be wrong when the people really want change.

It would be a shock, and uncertainty will follow. No doubt Gold would rocket, back to the highs, and possibly beyond as time moves by.

The only piece of data before then which has the potential to shift the Gold price higher is the Non-Farm Payroll data on Friday.

On 3rd of June the NFP data came in below forecasts by a huge amount. It was forecast for 159k and actual landed at 38k.

This saw Gold rocket from the 3 month low to above $1300 during the next two weeks preceding the Brexit vote. If NFP is skewed again, maybe Gold will set off on a run before the election, although it could be somewhat subdued following through until next week is out of the way.

Either way there are some interesting days ahead for those who follow Gold.


from http://www.livecharts.co.uk/livewire/2016/11/gold-prices-and-where-next-at-this-resistance/

Tuesday, 1 November 2016

Interest Rates Abound as Election Time Looms

As we move ever closer to the US election, what more could you ask for than a week packed with highly anticipated economic data? Expect Gold and stock indices to be volatile as we move into the second half of the week. Here’s a quick rundown of what’s about to land.

Already, as of Tuesday November 1st we’ve had BoJ and Australian interest rate announcements. The Bank of Japan held their already negative rate at -0.10%, and Australia remained unchanged at 1.5%.

The Australian Dollar headed straight up towards October highs against the US Dollar on the decision that matched forecasts, whilst USDJPY was static in comparison.

Tomorrow, Wednesday 2nd November, we’ve the big event. All eyes will be focused on the Federal Funds Rate in the USA. It’s been 11 months since they hiked the rate for the first time in years. Whilst it’s widely forecast to remain unchanged maybe there’s a surprise in store?

Gold has been creeping up slowly during the last few trading days, which seems to suggest traders are betting on the forecast of “no change” holding true.

Thursday 3rd of November is the United Kingdom’s turn. At midday UK time the Bank of England drops its monthly rate decision, again it’s expected to be unchanged at 0.25%. The rate was lowered in August as the uncertainty of Brexit hit hard on the Pound. Alongside the BoE rate, they also publish their inflation report. All in all it should be a volatile time for traders of GBP.

If all this is not enough for you, then make time for Friday’s Non-Farm Payroll data in the USA. It’s always a big market mover, and probably even more so after the Fed reporting in the same week.

Forecasts are that the figure will increase by 20k on the month however it missed, and fell by near 20k last month, so another miss may be the trigger to cause some volatile swings on stock indices.

This sets us up nicely for the ride into election time, November 8th. By the back end of next week we should know who will be the leader for the next 4 years. This in itself will probably cause major volatility, as it’s been the most unusual election in most peoples living memory.


from http://www.livecharts.co.uk/livewire/2016/11/interest-rates-abound-as-election-time-looms/

Wednesday, 21 September 2016

Fed Meeting Set To Show The Way

The next installment of the Federal Reserve meeting, with the press release that is published at close the meeting of the Monetary Policy Committee. This is followed by a press conference hosted by the president of the Fed, Janet Yellen. All eyes are on comments surrounding interest rates, and how the Fed see’s the economy is fairing.

Today on the foreign exchange market, the Euro was trading within narrow ranges despite the huge adjustment in policy by the Bank of Japan (BoJ). Although it is normal for the Euro to trade static in light of a upcoming Fed meeting.

The euro has remained steady against the dollar at 1.1149 and versus the Yen at 113.03

During the night, the Bank of Japan (BoJ), the Monetary Policy Committee announced new measures. The BoJ has decided to adopt a target on its long-term interest rates. This change in its monetary policy strategy is a surprise, three years after the launch of a bold policy of the Governor Haruhiko Kuroda, who gave way to skepticism about its effectiveness.

According to analysts the objective is to try and counter the negative effects of redemption of bond assets in bulk, pulling the short interest rate and longer term under 0.

In the USA, Fed funds futures anticipate a rate hike this evening with a probability of 15%. From the many economists surveyed by Bloomberg, only 4 anticipate a rise in Fed Funds tonight, barely 4% of consensus. Which is usually a sign that there will be no change, however there is always room for a shock.

As always expect volatile moves after the Fed release their data. Stocks, Gold and Foreign Exchange markets are poised to make a move, guessing can spell disaster. Whilst these data sets can change a trend, more often than not they do not change the longer term direction, once the initial volatility has subsided.


from http://www.livecharts.co.uk/livewire/2016/09/fed-meeting-set-to-show-the-way/

Thursday, 8 September 2016

FTSE 100 and Dow Jones: Can They Head Higher This Year?

Indices in the UK and USA have been on a phenomenal run since the early February, a rise that accelerated with post Brexit relief. Whilst the FTSE 100 stumbled its way up slowly in anticipation of the Brexit vote, the Dow Jones Industrial Average has been strong all the way through, really strong. So much so that it’s now standing at all-time highs above 18400.

But what is next for these blue chip indices? Can this strength continue, or will it all end in tears?

FTSE 100 Index

Banks are still lagging somewhat. And so are home builders, since being hit with uncertainty of Brexit. Although they’ve recovered slightly from those lows, there’s still room for more in the main players. Barclays share price remains under £2, Lloyds share price remains under 60p. If banks can begin to shed some of the negative sentiment that Brexit brought them, this could help push the FTSE 100 higher into winter.

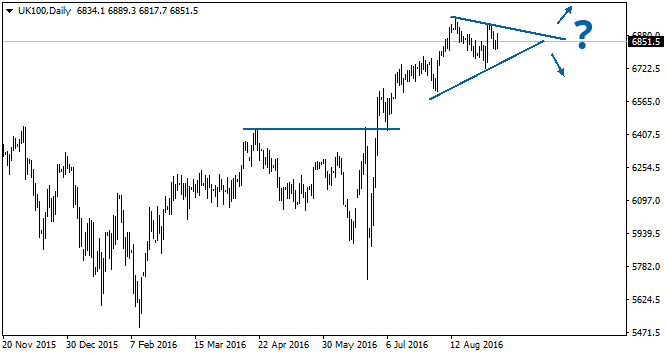
The chart below shows the breakout point of the early 2016 high and subsequent rise to a touch underneath 7000. Will it push multi-year highs like its US cousin? Probably, but only if banking stocks and home builders begin to pull their weight again.

ftse 100 daily

Dow Jones Index

Stocks in the Dow Jones are flying, it’s fair to say. Bank of America has put on near to 50% this year alone. The Home Depot printed a new all-time high, as did General Electric Company. Whilst Apple has stuttered compared to previous years, other tech stocks like Microsoft Corporation have been in a strong upward trend.

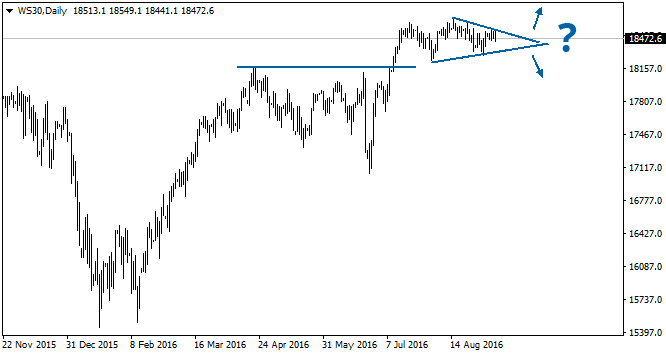
In the chart below you can see (like the FTSE 100) a breakout of early 2016 high into a small wedge like pattern which seems to be consolidating at new all-time highs.

Dow Jones Daily

Will it push higher? This is a tricky question. Its election year in the USA, and there’s no hiding from the fact that if Trump gets into the White House, this will bring uncertainty. The US markets are usually strong running into elections, which seems to be the pattern right now, whether this will continue post-election is the million dollar question.

One thing to watch: If Trump wins the election there will most likely be a rush of money into Gold from Stocks. Keep an eye on Gold as we approach the election, it may give some clues as to which way traders are placing their bets.


from http://www.livecharts.co.uk/livewire/2016/09/ftse-100-and-dow-jones-can-they-head-higher-this-year/

Thursday, 21 July 2016

Is This The New Trend Line For Gold?

We’ve all been amazed by the trend in Gold prices during 2016 so far, but this last few weeks, since a spike higher after the Brexit decision, Gold has fallen back somewhat. Is the Gold bull over for 2016? Or is this just another dip to buy into?

It’s obvious at some point the strong trend will end. After all, profit needs to be taken before a new leg up can commence. Usually the speculators will unwind over-leveraged long positions, and prices will fall until they reach a technical level, or another key piece of economic data goes in favour of Gold.

There are some who think we may see a sustained correction in Gold, as the US presidential election begins to take hold. Often the run in to the election sees a strong stock market. Whilst they often never move in tandem, this year (so far) they have, which is somewhat unusual.

So from a technical point of view, is there anything to look at, up here at the dizzy heights of $1300+ for Gold?

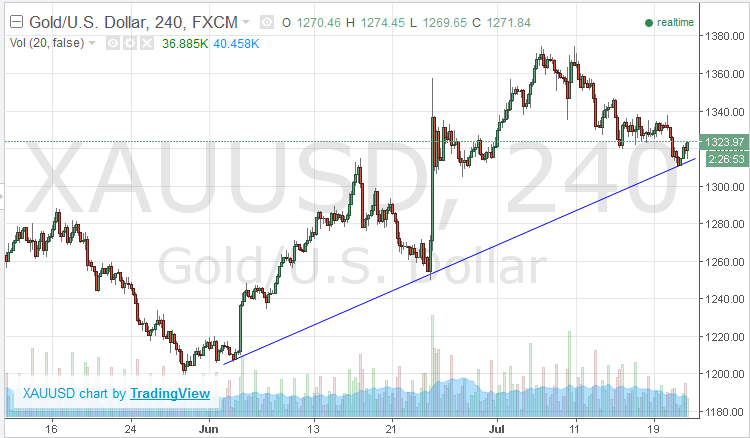
My eyes immediately hooked onto a trend line, which begins at the Brexit spike, and seems to have bounced from it in early trading today.

gold-chart

It’s not a sure thing, but it seems about the only level, apart from the $1300 resistance we broke through in late June, that could offer a turn from this current slide in Gold prices.

If it does adhere to the line, then you would think Gold may try to attempt to reach $1390 or thereabouts, which is the early 2014 high. We all know it does like to go test, and re-test these technical levels for volume. I’d be certain if it got to that point, there would be plenty!

For long term though, Gold seems a good long bet as long as buyers keep appearing under technical levels.


from http://www.livecharts.co.uk/livewire/2016/07/is-this-the-new-trend-line-for-gold/